OLD
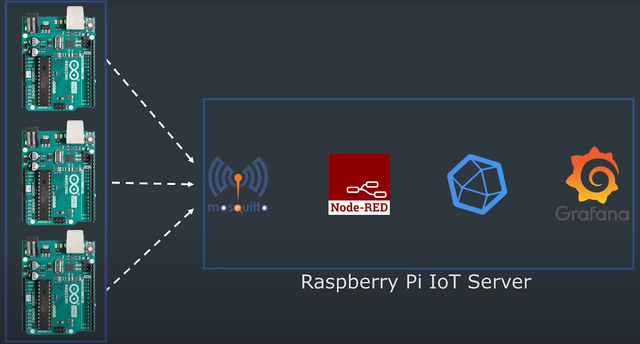
The plan is to manage everything via containers so that everything can be easily migrated when the server is changed:
Prerequisites
Info: for testing purposes I did not use a Pi but a DebianVM and connected to the machine via ssh!
Installation of IOTstack and Portainer setup
- First make OS updates and then install “curl” (if not already present):
sudo apt update
sudo apt upgrade
sudo apt install curl- Then install IOTstack via curl and restart (if not automatically by install script):
sudo curl -fsSL https://raw.githubusercontent.com/SensorsIot/IOTstack/master/install.sh | bash
sudo shutdown -r now- After restarting, a new folder “IOTstack” should appear. Execute the “menu.sh” once there:
cd IOTstack
sudo ./menu.sh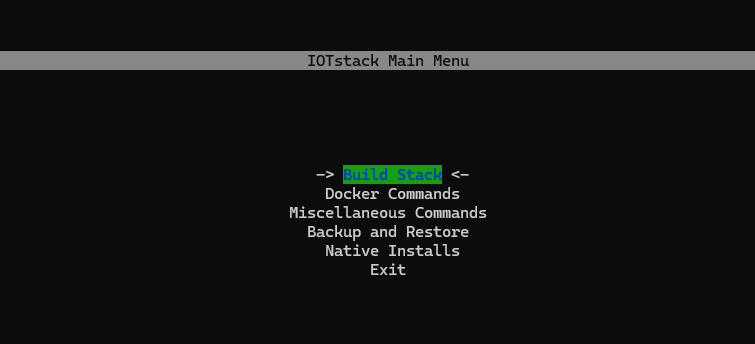
-
Execute “Build Stack” in the IOTstack menu and select (“Spacebar”) all services (Grafana, InfluxDB, mosquitto, nodered, portainer-ce (optional):
- When selecting the option “nodered” an error occurs. Only then “arrow key to the right” must be pressed and then the addons list.yml must be overwritten!
-
When everything is selected, press “Enter” to install and start stack. If you then go out of the menu (via CTRL-C) and then enter (see below) all containers should run:
docker ps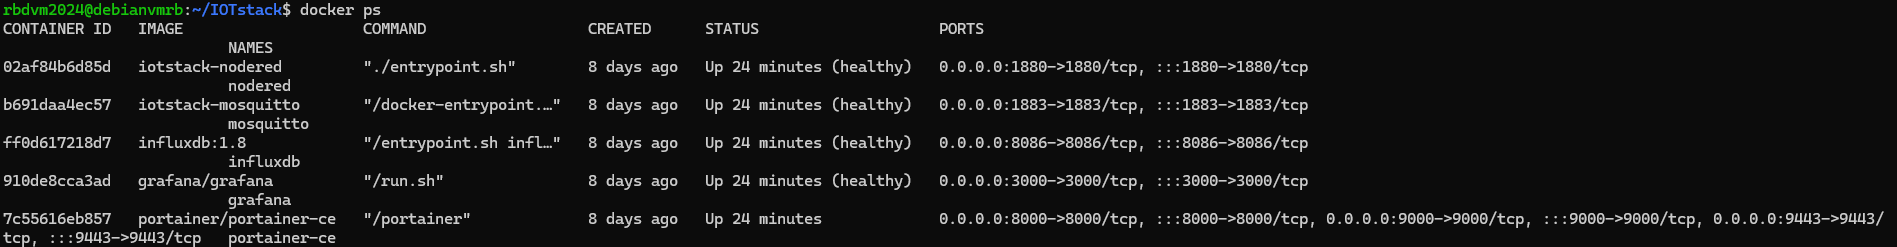
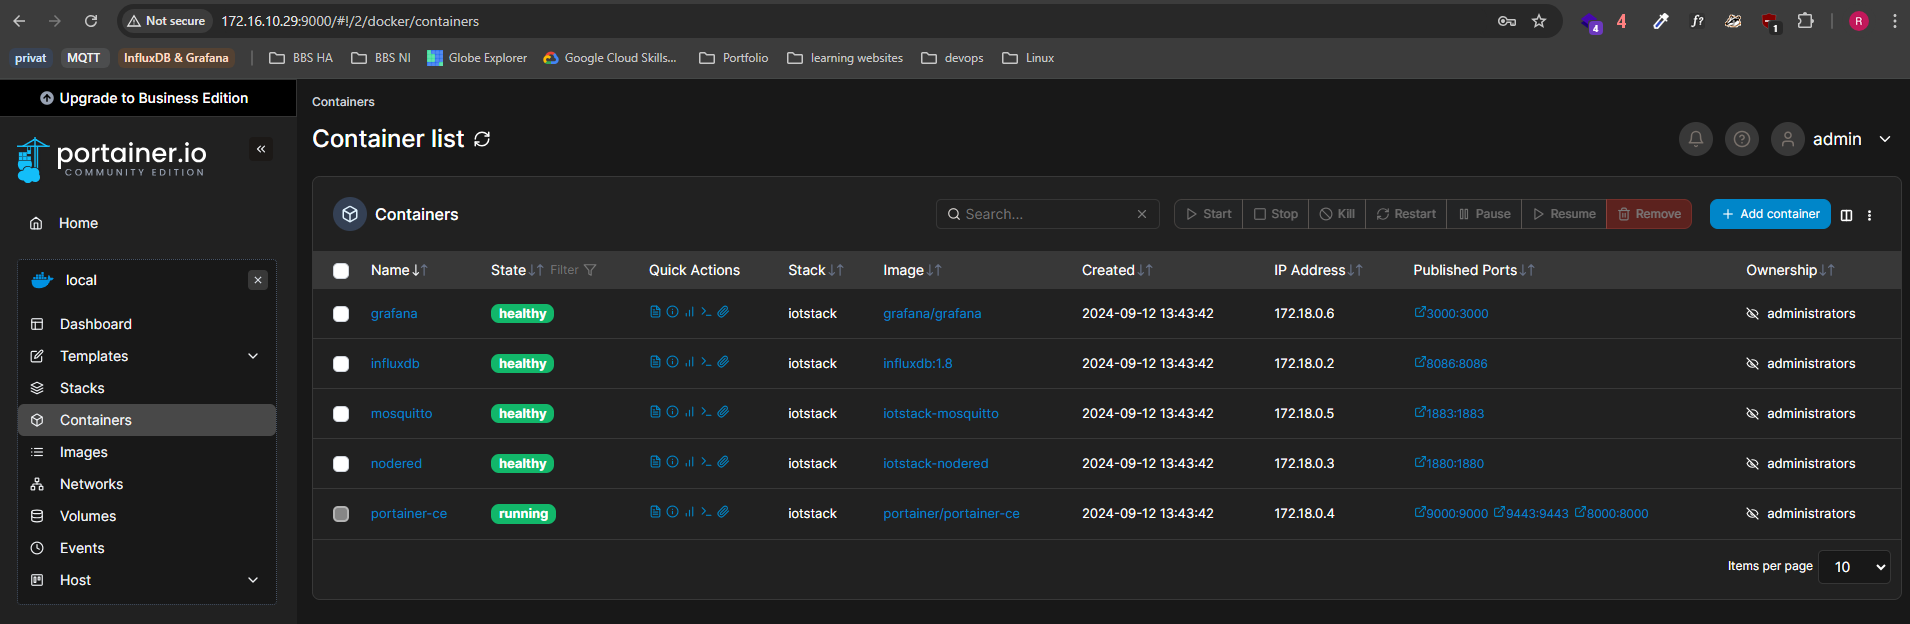
- Optional! If you use Portainer, you can use the port “9000” via web browser.
- default is “admin” for user and pw. Then change PW!
- you can then log everything via GUI & ssh etc:
- if portainer pw is forgotten:
docker run --rm -v /home/*User*/IOTstack/volumes/portainer-ce/data:/data portainer/helper-reset-passwordInfluxDB, Nodered & Grafana configuration
- now the database must be created, which stores all data that is published to the Brocker to the specific topic “Temp”:
docker exec -it influxdb influx
|Connected to http://localhost:8086 version 1.8.10|
|InfluxDB shell version: 1.8.10|
> CREATE DATABASE *Name der Datenbank*
> show databases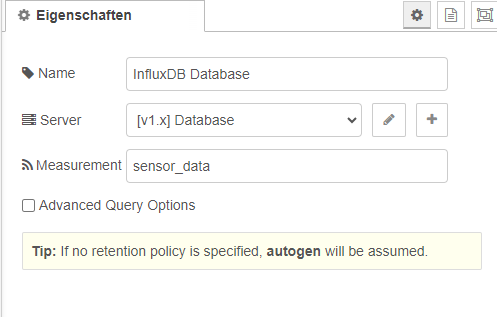
> quit- Then start Node-Red via port “1880” in the web and connect two nodes (MQTT OUT & InfluxDB IN):
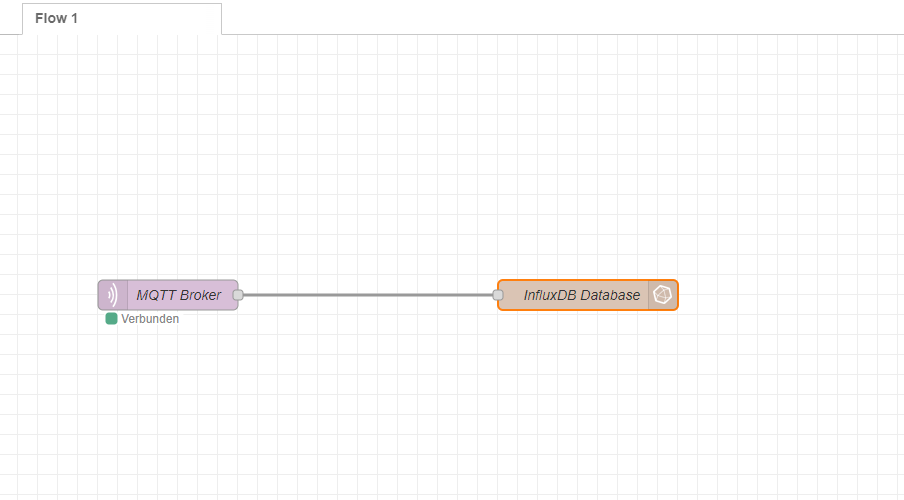
Enter the IP of the MQTT container there, as well as for the InfluxDB. For the InfluxDB node, it is also important that the “Measurement” is also entered (all data is stored in the database under this value):
- Now you can test if data is saved in the database, I have a bash script for this:
#!/bin/bash

# Function for checking whether a number is between 15 and 35
function is_valid_number() {
  local number="$1"
  if [[ "$number" =~ ^[1-3][5-9]$|^[2-3][0-5]$ ]]; then
    return 0
  else
    return 1
  fi
}

# Preset-Funktion
function use_preset() {
  # You can define your desired preset here
  local preset_numbers=(15 19 21 25 28 31 31 29 25 20)
  # Copy preset_numbers into the numbers_array
  numbers_array=("${preset_numbers[@]}")
}

# Prompt for preset or manual input
while true; do
  read -p "Would you like to use the preset? (y/n): " use_preset_choice
  if [[ "$use_preset_choice" == "y" || "$use_preset_choice" == "n" ]]; then
    break
  else
    echo "Please enter only 'y' or 'n'."
  fi
done

if [[ "$use_preset_choice" == "y" ]]; then
  use_preset
else
  # Prompt for 10 numbers
  read -p "Enter 10 numbers between 15 and 35 (separated by spaces): " numbers
  # Save numbers in an array
  numbers_array=($numbers)
fi

# Checking the numbers (performed for both cases)
for number in "${numbers_array[@]}"; do
  if ! is_valid_number "$number"; then
    echo "Invalid number: $number. Please only enter numbers between 15 and 35."
    exit 1
  fi
done

# MQTT-Topic
topic="Temp"

# Publish each number as a separate message and output it
for number in "${numbers_array[@]}"; do
  mosquitto_pub -d -t "$topic" -m "$number"
  echo "sent: $number"
  sleep 5
done
since everything now runs via docker, there is no need to run a broker natively on the vm. To continue using the script or mosquitto in general as a client (for sub or pub), the minimal install of mosquitto without broker is sufficient:
sudo apt install mosquitto-clientsthen execute script:
sudo ./*name of the scripts.sh*
> Would you like to use the preset? (y/n): y
Client (null) sending CONNECT
Client (null) received CONNACK (0)
Client (null) sending PUBLISH (d0, q0, r0, m1, 'Temp', ... (2 bytes))
Client (null) sending DISCONNECT
sent: 15
and check the database:
docker exec -it influxdb influx
Connected to http://localhost:8086 version 1.8.10
InfluxDB shell version: 1.8.10
> use temp_data
Using database temp_data
> show measurements
name: measurements
name
----
sensor_data
> select * from sensor_data
name: sensor_data
time                value
----                -----
1726142261472151995 15
1726142266516634318 19
1726142271607565314 21
1726142276669001790 25
1726142281757281851 28
1726142286883078815 31
1726142291943353686 31
1726142297015629617 29
1726142302080929271 25
1726142307171691848 20-
Now that everything is running on the database, the data only needs to be visualized via Grafana (Port 3000):
- Set PW again!
- then set the data source to InfluxDB:
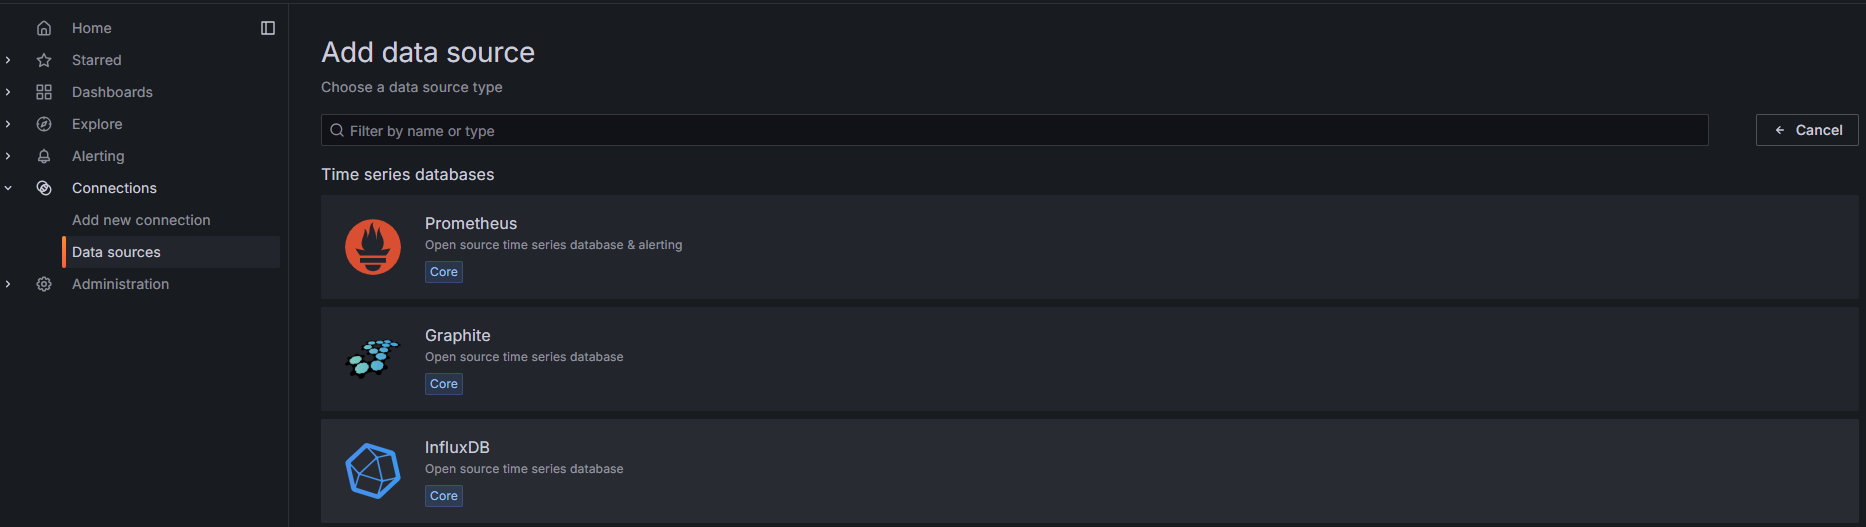
- And then configure it:
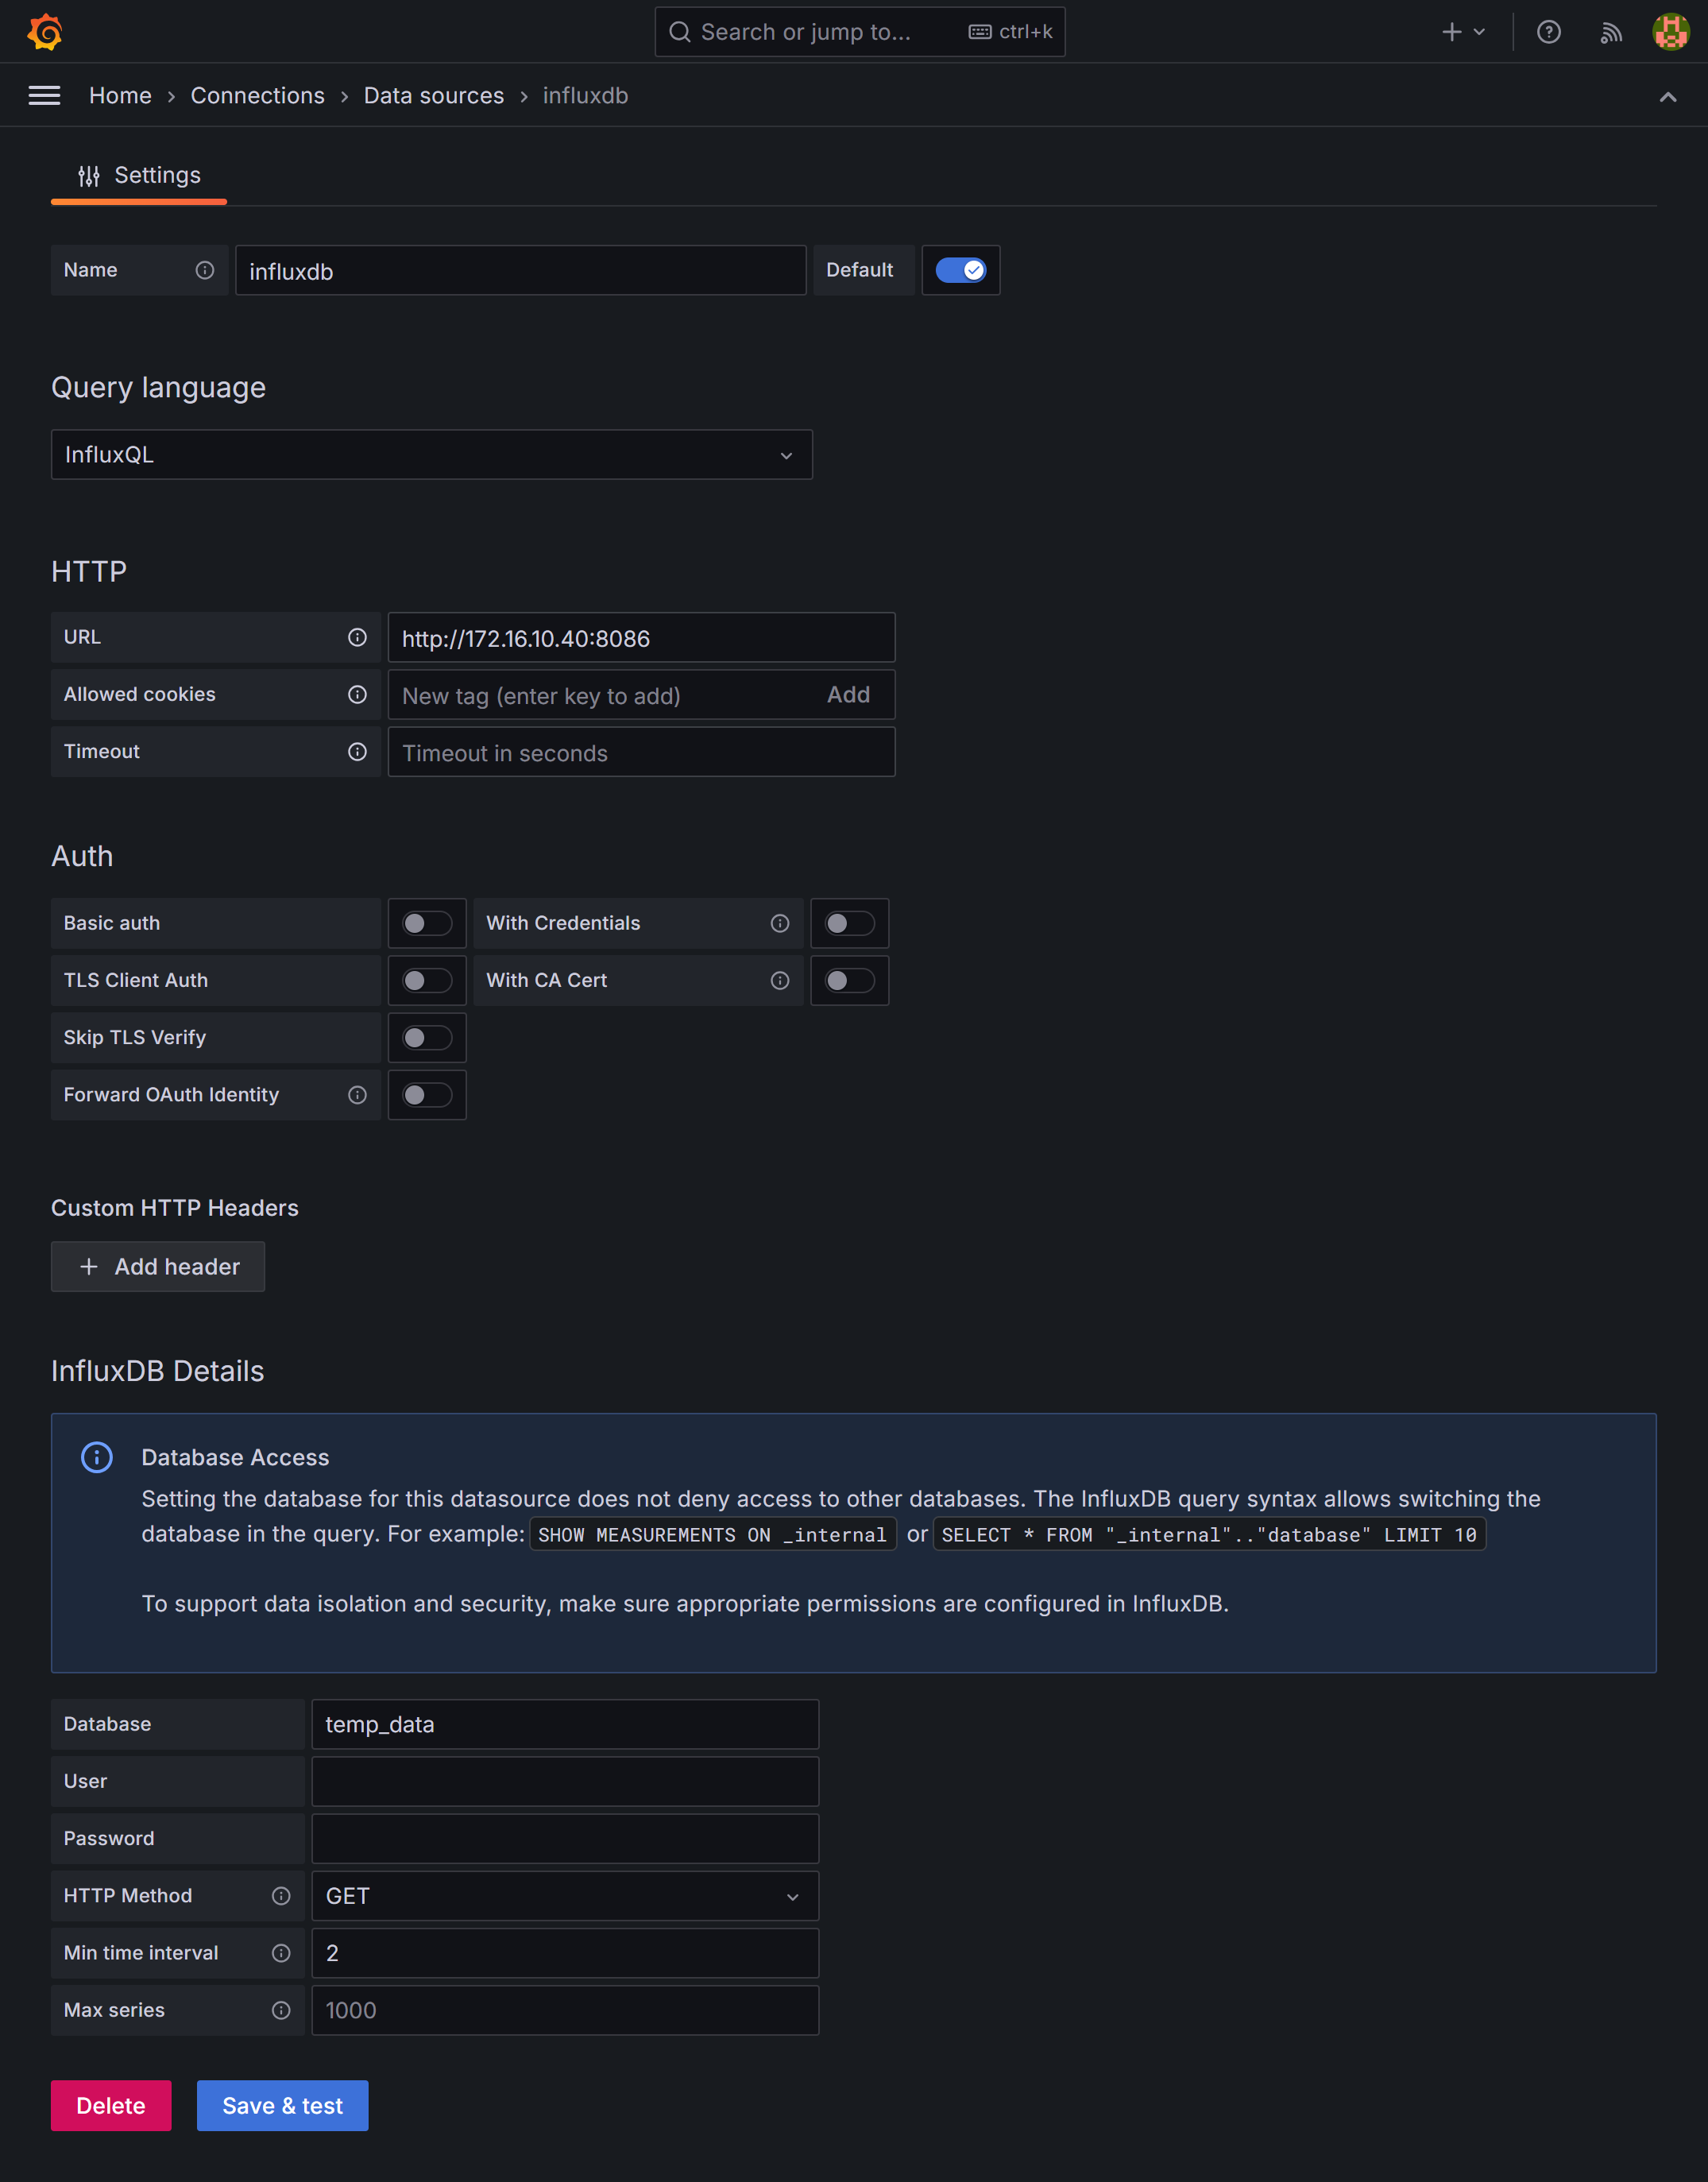
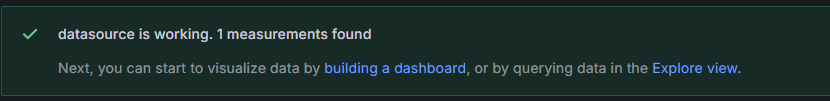
- Important that this message appears when you press “Save & test”:
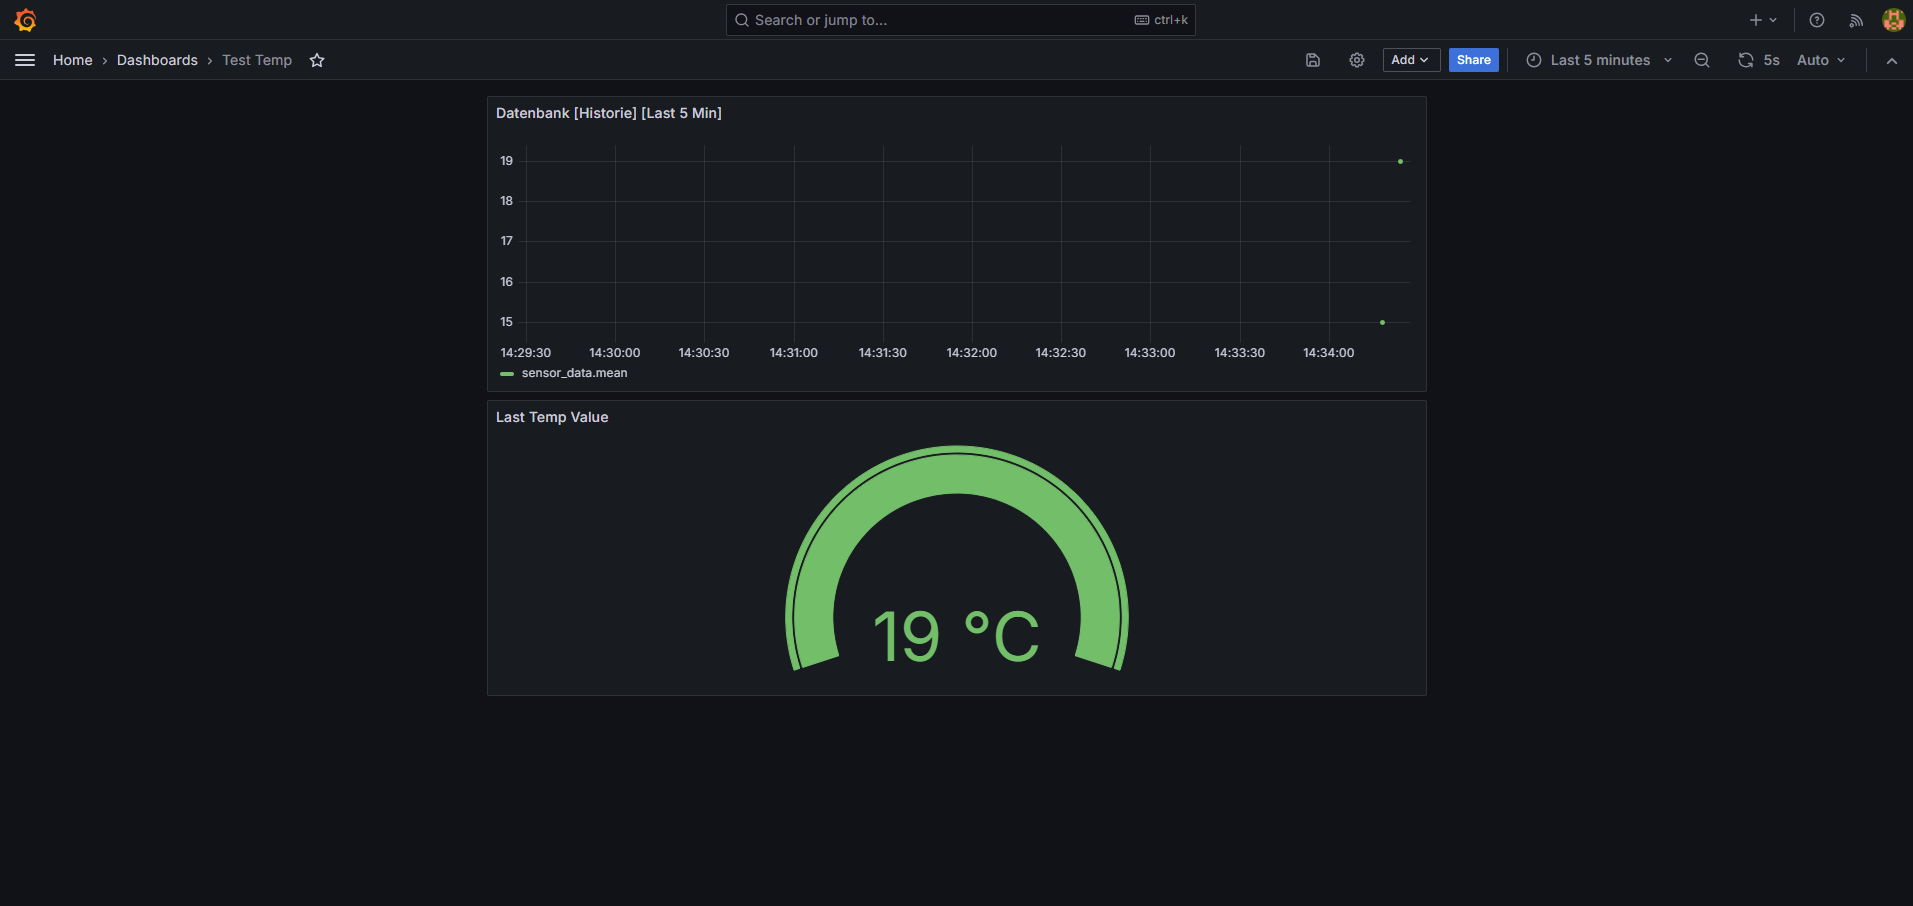
- Now set the dashboard to user-defined, it could look like this, for example:
If you want to mount the container to customize something:
docker exec -it <container> bashIf pw forgotten in grafana via portainer bash!:
grafana cli --homepath "/usr/share/grafana" admin reset-admin-password <new password>To edit files that are in a Docker container simply:
docker cp <container>:/path/to/file.ext .to create a copy on the local computer (in the current directory). Then edit the file locally with your preferred editor and then run
docker cp file.ext <container>:/path/to/file.extto replace the old file.
TMP35 temperature measurement incl. ADS1115 analog-digital converter
Summary of the connections
| Component | Function | Connected to |
|---|---|---|
| TMP35 (pin 1) | VCC | 3.3V rail of the breadboard |
| TMP35 (pin 2) | Vout | A0 (channel 0) of the ADS1115 |
| TMP35 (pin 3) | GND | GND rail of the breadboard |
| ADS1115 VDD | power supply | 3.3V rail of the breadboard |
| ADS1115 GND | Ground | GND rail of the breadboard |
| ADS1115 SCL | clock line | GPIO 3 (SCL, pin 5) of the Raspberry Pi |
| ADS1115 SDA | data line | GPIO 2 (SDA, pin 3) of the Raspberry Pi |
| ADS1115 ADDR | address | GND (sets I²C address to 0x48) |
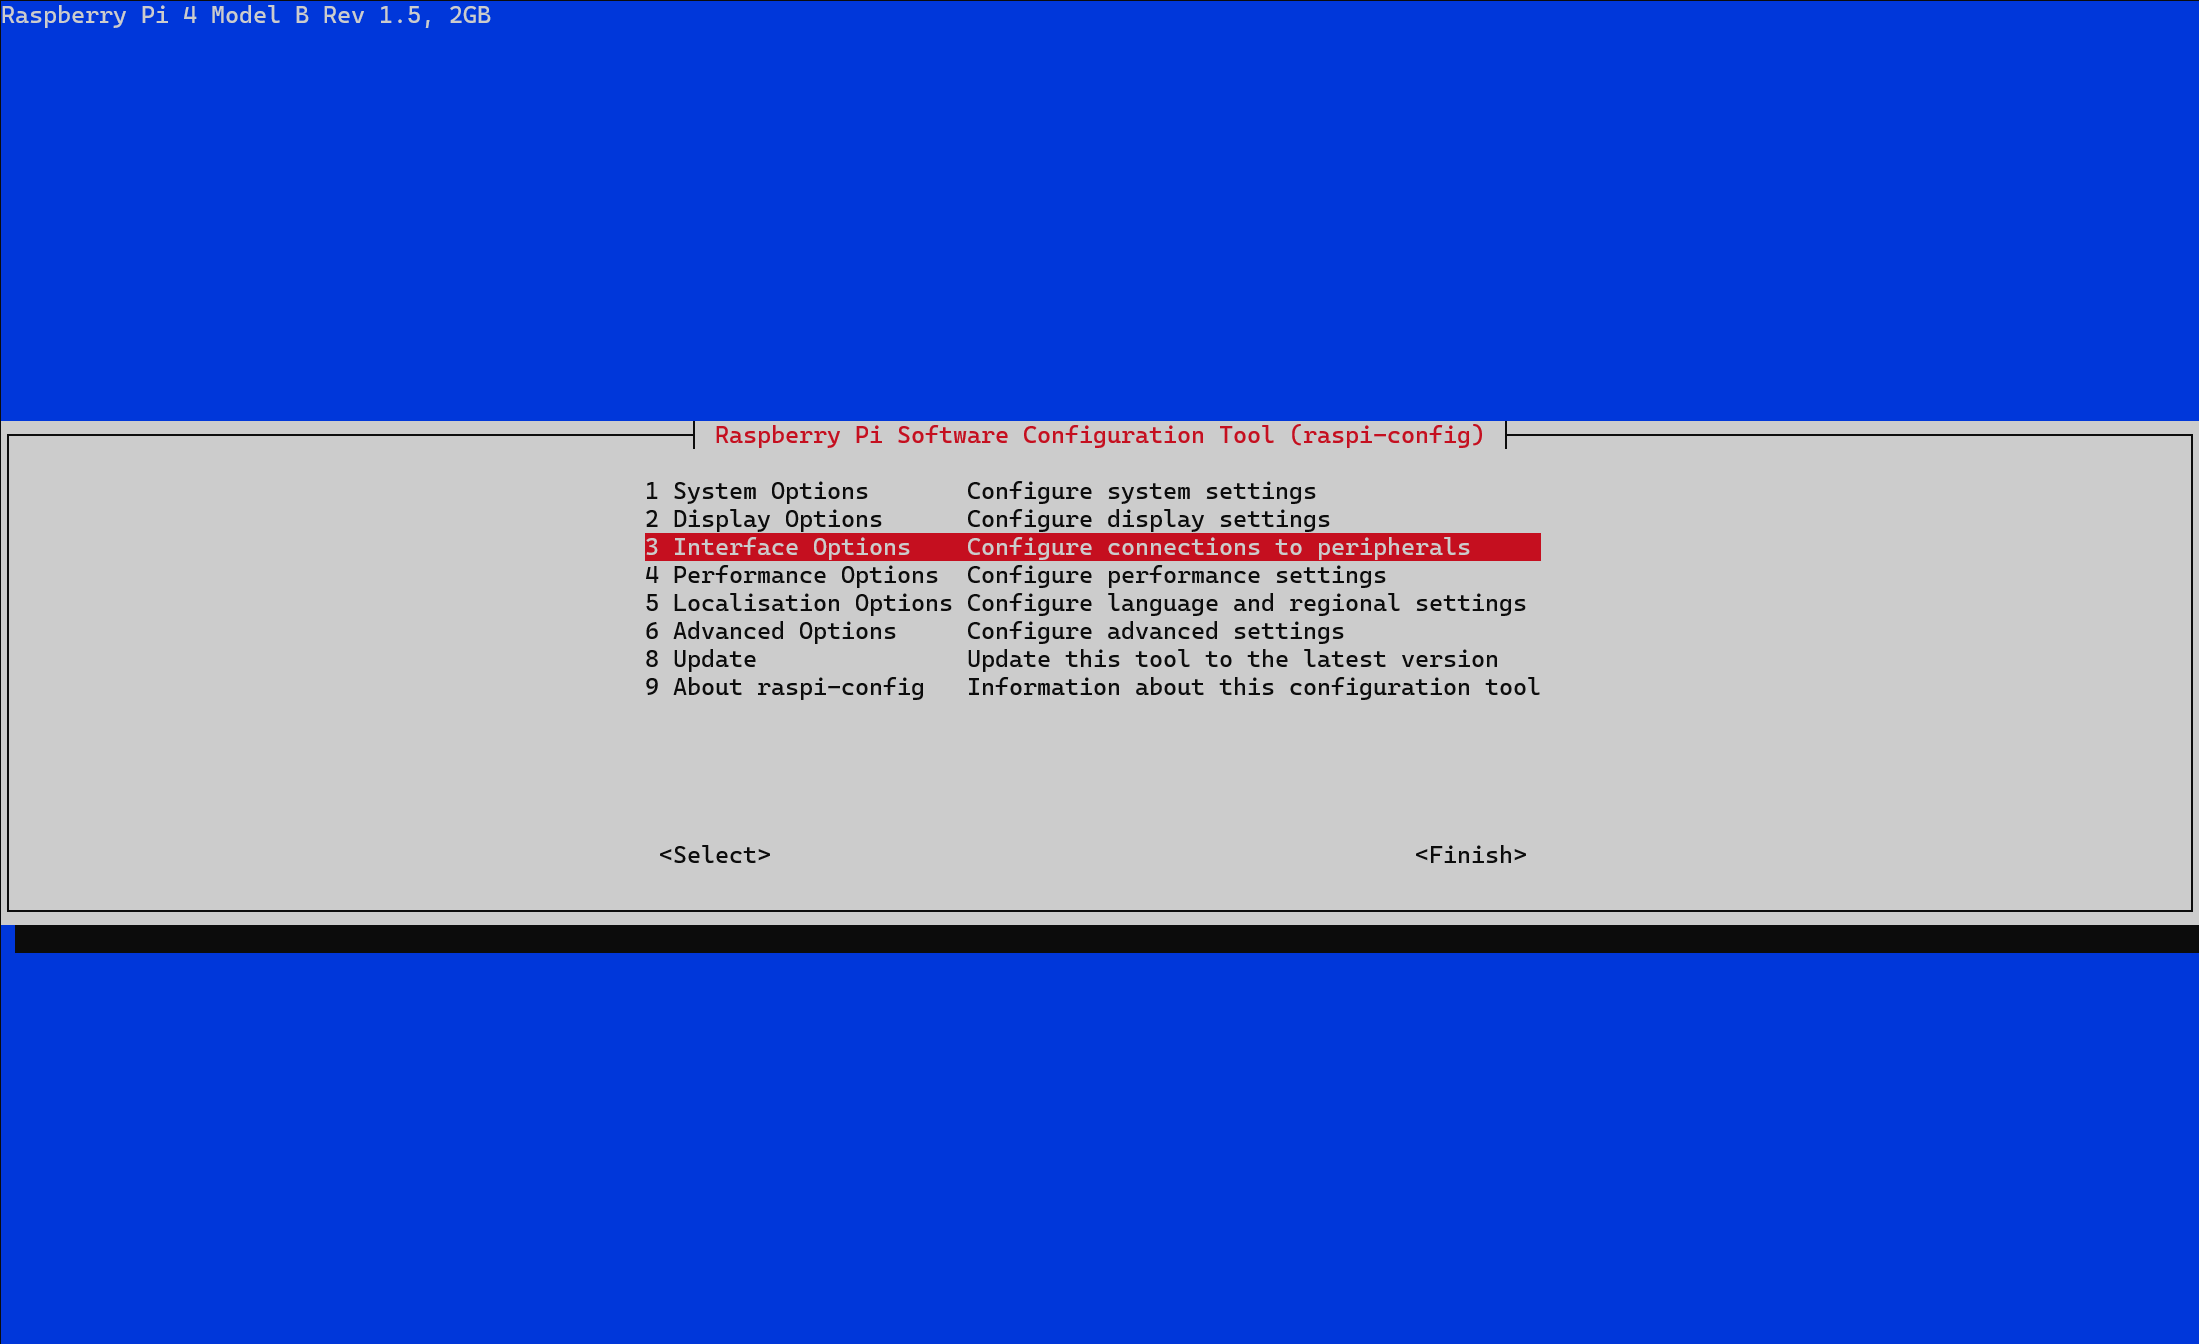
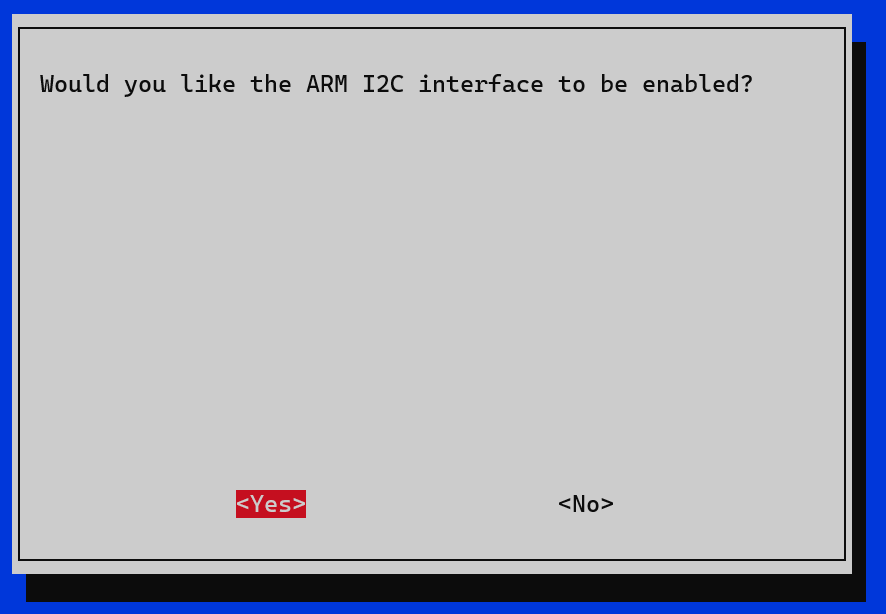
| As soon as everything on the breadboard is connected to the GPIO of the PI, I²C must be activated. |
sudo raspi-configThen select “Interface Options” in the “raspi-config” menu + Enter
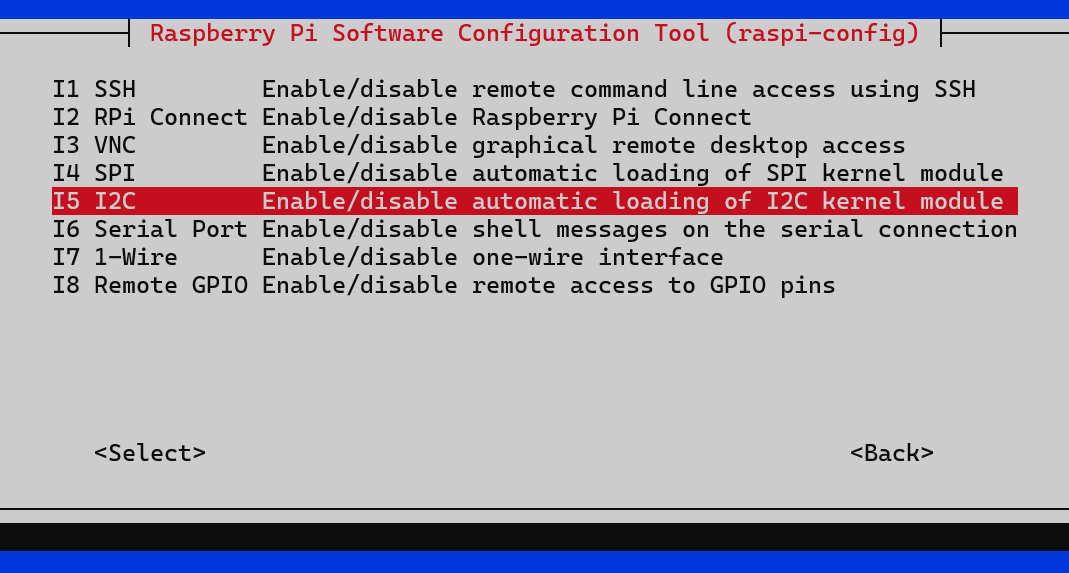
Select “I2C” in the “Interface Options” + Enter and activate I2C with “yes”
Then restart the Pi once:
sudo shutdown -r nowYou can now use the “i2cdetect tool” to check whether the I²C connection of the ADS1115 is correct:
sudo i2cdetect -y 1In the output table you should see the address of the ADS1115, which is 0x48 by default (if the ADDR pin is connected to GND):
The output should look something like this:
    0  1  2  3  4  5  6  7  8  9  A  B  C  D  E  F
00:          -- -- -- -- -- -- -- -- -- -- -- -- --
10: -- -- -- -- -- -- -- -- -- -- -- -- -- -- -- --
20: -- -- -- -- -- -- -- -- -- -- -- -- -- -- -- --
30: -- -- -- -- -- -- -- -- -- -- -- -- -- -- -- --
40: 48 -- -- -- -- -- -- -- -- -- -- -- -- -- -- --
50: -- -- -- -- -- -- -- -- -- -- -- -- -- -- -- --
60: -- -- -- -- -- -- -- -- -- -- -- -- -- -- -- --
70: -- -- -- -- -- -- -- --
Depending on how you have placed the 3.3V rail & the GND rail on the breadboard, the table may look slightly different:
     0  1  2  3  4  5  6  7  8  9  a  b  c  d  e  f
00:                         -- -- -- -- -- -- -- --
10: -- -- -- -- -- -- -- -- -- -- -- -- -- -- -- --
20: -- -- -- -- -- -- -- -- -- -- -- -- -- -- -- --
30: -- -- -- -- -- -- -- -- -- -- -- -- -- -- -- --
40: -- -- -- -- -- -- -- -- 48 -- -- -- -- -- -- --
50: -- -- -- -- -- -- -- -- -- -- -- -- -- -- -- --
60: -- -- -- -- -- -- -- -- -- -- -- -- -- -- -- --
70: -- -- -- -- -- -- -- --
It is only important that the value “48” is displayed!
Now update the system & install Python:
sudo apt update
sudo apt install -y python3-pip
After Python has been installed, you can create a virtual environment for the Python script:
python3 -m venv ~/ads1115_env # the name of the environment is an exampleto activate the environment:
source ~/ads1115_env/bin/activateto leave the environment:
deactivateThe required libraries for the environment are then installed:
pip install adafruit-blinka
pip install adafruit-circuitpython-ads1x15
Now you can create the Python script for temperature measurement:
nano test_ads1115.py # Of course you can also use another editor aswell :)This is the Python code:
import time
import board
import busio
import adafruit_ads1x15.ads1115 as ADS
from adafruit_ads1x15.analog_in import AnalogIn

# Establish I2C connection
i2c = busio.I2C(board.SCL, board.SDA)

# Initialize ADS1115
ads = ADS.ADS1115(i2c)
chan = AnalogIn(ads, ADS.P0)  # A0 für TMP35

def convert_to_temperature(voltage):
    # TMP35 outputs 10 mV per °C, offset 0.5V for 0°C
    temperature = (voltage - 0.5) * 100
    return temperature

try:
    while True:
        voltage = chan.voltage
        temperature = convert_to_temperature(voltage)
        print(f"voltage: {voltage:.2f} V, temperature: {temperature:.2f} °C")
        time.sleep(1)
except KeyboardInterrupt:
    print("Measurement ended")
Then save and execute with this command (check that you are in the environment!):
python test_ads1115.pyThe output should then look like this:
(ads1115_env) pimqtt@pimqtt:~/scripts $ python test_ads1115.py
voltage: 0.63 V, temperature: 12.52 °C
voltage: 0.62 V, temperature: 12.50 °C
voltage: 0.62 V, temperature: 12.46 °C
voltage: 0.62 V, temperature: 12.44 °C
voltage: 0.63 V, temperature: 12.58 °C
voltage: 0.63 V, temperature: 12.90 °C
voltage: 0.63 V, temperature: 12.55 °C
voltage: 0.63 V, temperature: 12.58 °C
voltage: 0.62 V, temperature: 12.45 °C
voltage: 0.62 V, temperature: 12.45 °C
voltage: 0.63 V, temperature: 13.06 °C
voltage: 0.62 V, temperature: 12.44 °C
voltage: 0.63 V, temperature: 12.56 °C
voltage: 0.65 V, temperature: 14.64 °C
voltage: 0.62 V, temperature: 12.49 °C
voltage: 0.63 V, temperature: 12.64 °C
voltage: 0.63 V, temperature: 13.34 °C
Now you can test whether the data is also sent to the database via MQTT, for this we have to adapt the script (in this case simply I wrote a new script):
import time
import board
import busio
import adafruit_ads1x15.ads1115 as ADS
from adafruit_ads1x15.analog_in import AnalogIn
import subprocess

# Establish I2C connection
i2c = busio.I2C(board.SCL, board.SDA)

# Initialize ADS1115
ads = ADS.ADS1115(i2c)
chan = AnalogIn(ads, ADS.P0)  # A0 für TMP35

# MQTT-configuration
mqtt_broker = "x.x.x.x"  # IP address of the MQTT broker
mqtt_port = "1883" # Port of the MQTT broker
mqtt_topic = "Temp" # Topic of the message

# Function for converting voltage to temperature
def convert_to_temperature(voltage):
    # TMP35 outputs 10 mV per °C, offset 0.5V for 0°C
    temperature = (voltage - 0.5) * 100
    return temperature

# Function for sending a message with Mosquitto Client
def publish_mqtt_message(topic, payload):
    try:
        subprocess.run(
            ["mosquitto_pub", "-h", mqtt_broker, "-p", mqtt_port, "-t", mqtt_topic, "-m", payload],
            check=True
        )
        print(f"MQTT Message sent: {payload}°C")
    except subprocess.CalledProcessError as e:
        print(f"Error sending the MQTT message: {e}")

try:
    count = 0  # Counter for the measurements
    while True:
        voltage = chan.voltage
        temperature = convert_to_temperature(voltage)
        print(f"voltage: {voltage:.2f} V, temperature: {temperature:.2f} °C")

        # Send the temperature to the MQTT broker every 5 measurements
        count += 1
        if count % 5 == 0:
            payload = f"{temperature:.2f}"
            publish_mqtt_message(mqtt_topic, payload)

        time.sleep(1)

except KeyboardInterrupt:
    print("Measurement ended")
Before you run the script now, check if your NodeRED connection from the broker to the database is adjusted, if either the MQTT topic does not match and or the measurement of your InfluxDB database does not match (in my context I created a new measurement because I still had the simulated temp data in the old measurement)
If everything fits, you can run the script as a test:
(ads1115_env) pimqtt@pimqtt:~/scripts $ python test_ads1115_mosquitto.py
voltage: 0.66 V, temperature: 16.11 °C
voltage: 0.67 V, temperature: 16.80 °C
voltage: 0.67 V, temperature: 16.79 °C
voltage: 0.67 V, temperature: 16.65 °C
voltage: 0.67 V, temperature: 16.86 °C
MQTT Message sent: 16.86°C
voltage: 0.66 V, temperature: 16.26 °C
voltage: 0.66 V, temperature: 16.00 °C
voltage: 0.66 V, temperature: 16.28 °C
voltage: 0.66 V, temperature: 16.01 °C
voltage: 0.66 V, temperature: 16.19 °C
MQTT Message sent: 16.19°C
voltage: 0.67 V, temperature: 16.80 °C
voltage: 0.67 V, temperature: 16.79 °C
voltage: 0.67 V, temperature: 16.76 °C
voltage: 0.67 V, temperature: 16.81 °C
voltage: 0.67 V, temperature: 16.83 °C
MQTT Message sent: 16.83°C
As soon as the first data has been sent to the database, the new measurement should also be selectable in Grafana:
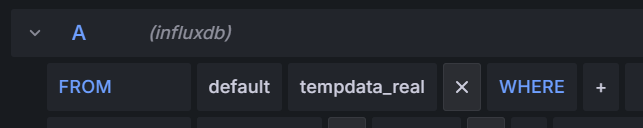
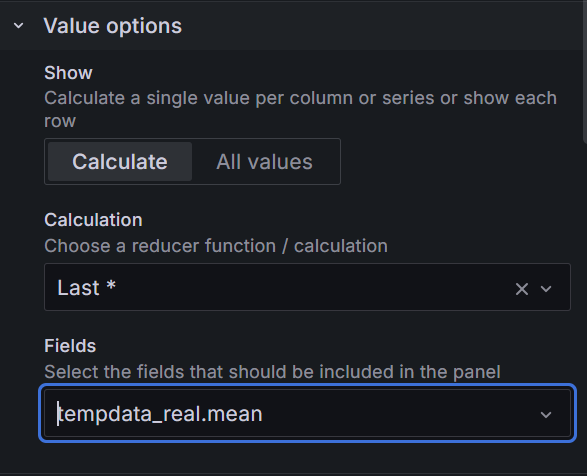
If you use a “Gauge” chart in Grafana, it is also important to select the correct fields (in my case “tempdata_real.mean”) in the “Value Options”:
DHT11 Sensor Skript mit MQTT
import time
import board
import adafruit_dht
from datetime import datetime
from luma.core.interface.serial import i2c
from luma.oled.device import sh1106
from adafruit_ssd1306 import SSD1306_I2C
from PIL import Image, ImageDraw, ImageFont
import subprocess
import RPi.GPIO as GPIO

# DHT11-Sensor initialisieren
dhtDevice = adafruit_dht.DHT11(board.D17)  # GPIO17 (Pin 11)

# I2C-Setup für das SH1106-Display (groß)
serial_large = i2c(port=1, address=0x3D)  # Adresse des großen Displays (0x3D)
oled_large = sh1106(serial_large, width=128, height=64)

# I2C-Setup für das SSD1306-Display (klein)
i2c_small = board.I2C()
oled_small = SSD1306_I2C(64, 48, i2c_small, addr=0x3C)  # Adresse des kleinen Displays (0x3C)

# Bild für Pillow erstellen
width_large, height_large = oled_large.width, oled_large.height
image_large = Image.new("1", (width_large, height_large))  # 1-Bit-Bild (Schwarz/Weiß)
draw_large = ImageDraw.Draw(image_large)

width_small, height_small = oled_small.width, oled_small.height
image_small = Image.new("1", (width_small, height_small))
draw_small = ImageDraw.Draw(image_small)

# Schriftart definieren
font = ImageFont.load_default()

# MQTT-Konfiguration
mqtt_broker = "192.168.182.45"  # IP-Adresse des MQTT-Brokers
mqtt_port = "1883"             # Standard-MQTT-Port
mqtt_topic_temp = "DHT11/Temperatur"  # Topic für Temperatur
mqtt_topic_humidity = "DHT11/Luftfeuchtigkeit"  # Topic für Luftfeuchtigkeit

# Zähler für die Messungen
count = 0

# GPIO-Setup für das Relais
RELAY_PIN = 18  # GPIO-Pin für das Relais
GPIO.setmode(GPIO.BCM)
GPIO.setup(RELAY_PIN, GPIO.OUT, initial=GPIO.HIGH)  # Relais standardmäßig auf HIGH (aus)

# Funktion, um MQTT-Nachrichten mit mosquitto_pub zu senden
def publish_mqtt_message(topic, payload):
    try:
        subprocess.run(
            ["mosquitto_pub", "-h", mqtt_broker, "-p", mqtt_port, "-t", topic, "-m", payload],
            check=True
        )
        print(f"MQTT Nachricht gesendet: Topic={topic}, Payload={payload}")
    except subprocess.CalledProcessError as e:
        print(f"Fehler beim Senden der MQTT-Nachricht: {e}")

# Funktion zum Aktualisieren des großen Displays
def update_large_display(temp, hum):
    draw_large.rectangle((0, 0, width_large, height_large), outline=0, fill=0)
    current_time = datetime.now().strftime("%H:%M:%S")
    draw_large.text((0, 0), f"Zeit: {current_time}", font=font, fill=255)
    draw_large.text((0, 20), f"Temp: {temp:.1f}°C", font=font, fill=255)
    draw_large.text((0, 40), f"Luftfeucht: {hum:.1f}%", font=font, fill=255)
    oled_large.display(image_large)

# Funktion zum Aktualisieren des kleinen Displays
import requests

def get_influxdb_count():
    INFLUXDB_HOST = "192.168.182.45"
    INFLUXDB_PORT = "8086"
    INFLUXDB_DATABASE = "tempdb"
    INFLUXDB_MEASUREMENT = "DHT11_T"

    INFLUX_QUERY = f"select count(*) from {INFLUXDB_MEASUREMENT}"
    url = f"http://{INFLUXDB_HOST}:{INFLUXDB_PORT}/query"
    params = {"db": INFLUXDB_DATABASE, "q": INFLUX_QUERY}

    try:
        response = requests.post(url, data=params)
        response_json = response.json()
        count = response_json["results"][0]["series"][0]["values"][0][1]
        return count
    except Exception as e:
        print(f"Fehler beim Abrufen der InfluxDB-Daten: {e}")
        return "N/A"

def update_small_display(temp):
    count = get_influxdb_count()
    draw_small.rectangle((0, 0, width_small, height_small), outline=0, fill=0)
    draw_small.text((5, 15), "Anzahl:", font=font, fill=255)
    draw_small.text((5, 25), str(count), font=font, fill=255)
    oled_small.image(image_small)
    oled_small.show()
    time.sleep(0.5)

# Funktion zum Steuern des Relais (Ventilator)
def stop_fan_for_2_seconds():
    print("Ventilator wird gestartet...")
    GPIO.output(RELAY_PIN, GPIO.LOW)  # Relais aktivieren (Ventilator an)
    time.sleep(2)
    GPIO.output(RELAY_PIN, GPIO.HIGH)  # Relais deaktivieren (Ventilator aus)
    print("Ventilator wird gestoppt.")

# Funktion zum Senden der Temperatur an den Apache2-Webserver
def send_temperature_to_webserver(temp):
    url = f"http://192.168.182.45/temperatur/include/temp_api.php?temp={temp}"
    try:
        response = requests.get(url)
        if response.status_code == 200:
            print(f"Temperatur erfolgreich an Webserver gesendet: {temp}°C")
        else:
            print(f"Fehler beim Senden der Temperatur. Statuscode: {response.status_code}")
    except Exception as e:
        print(f"Fehler bei der Verbindung zum Webserver: {e}")

try:
    while True:
        try:
            temperature = dhtDevice.temperature
            humidity = dhtDevice.humidity

            if humidity is not None and temperature is not None:
                print(f"Temperatur: {temperature:.1f} °C, Luftfeuchtigkeit: {humidity:.1f} %")
                count += 1

                if count % 5 == 0:
                    publish_mqtt_message(mqtt_topic_temp, f"{temperature:.1f}")
                    publish_mqtt_message(mqtt_topic_humidity, f"{humidity:.1f}")
                    stop_fan_for_2_seconds()
                    update_large_display(temperature, humidity)
                    update_small_display(temperature)
                    send_temperature_to_webserver(temperature)
            else:
                print("Fehler beim Lesen des DHT11-Sensors!")

        except RuntimeError as error:
            print(f"Lesefehler: {error}")

        time.sleep(1)

except KeyboardInterrupt:
    print("Messung beendet.")
    GPIO.cleanup()
    oled_large.clear()
    oled_large.show()
    oled_small.fill(0)
    oled_small.show()
Functional explanation of the TMP35 sensor & ADS1115 analog-digital-converter
Conversion formula from voltage to temperature TMP35
1. Basis of the formula
The TMP35 output voltage is linear to the measured temperature:
- : Output voltage (volts)
- : Temperature (°C)
- : Gradient, i.e. how much the voltage increases per degree of temperature (for TMP35: 10 mV/°C).
- : Offset, i.e. the output voltage at 0°C (for TMP35: 0.5 V).
The formula for calculating the temperature then only needs to be rearranged:
This formula describes the conversion from the output voltage (in volts) to the temperature (in degrees Celsius, °C).
2. Breakdown of the formula
a. Offset of 0.5 V:
- According to the sensor documentation, the output voltage of the TMP35 at 0 °C is exactly 0.5 V.
- To calculate the temperature, the measured voltage is therefore reduced by this value:
b. Scaling factor of 100:
-
The TMP35 has a sensitivity of 10 mV/°C (millivolts per degree Celsius).
-
This means that a change in voltage of 1 V corresponds to a temperature change of 100 °C.
-
The differentiated voltage is therefore multiplied by the factor 100:
-
In the formula, the scaling factor () was then changed to
3. Example formula
Assume that the TMP35 supplies an output voltage of 0.75 V:
- Deduction of the offset:
- Multiplication by the scaling factor:
- Formula summary:
The measured temperature is therefore 25 °C.
4. Additional information
- The TMP35 is designed for a supply voltage of 3 to 5.5 V. The conversion formula remains valid within this range.
- Temperature range: The TMP35 can measure temperatures from -10 °C to +125 °C. The linearity of the output voltage is maintained.
Functional explanation of the ADS1115 analog-to-digital converter
1. Basic principle of the ADS1115
The ADS1115 operates as follows:
- The ADC (analog-digital-converter) measures the analog input voltage at one or more inputs. (in my case at input A0)
- This voltage is converted into a digital value (a 16-bit number).
- The digital value is transmitted to the host (Raspberry Pi) via the I²C interface.
2. Voltage reference (V_REF)
The ADS1115 uses an internal reference voltage (V_REF), which is 2.048 V. This reference is used to convert the measured signal into a digital value.
Gain Amplifier (PGA)
- The ADS1115 has a programmable gain amplifier (PGA) that adjusts the measuring range.
- The gain influences the Full-Scale Range (FSR), i.e. the maximum voltage range that the ADC can measure.
- Examples of FSR for different PGA settings:
- ±6.144 V (PGA = 2/3)
- ±4.096 V (PGA = 1)
- ±2.048 V (PGA = 2) → Standard
- ±1.024 V (PGA = 4)
- ±0.512 V (PGA = 8)
- ±0.256 V (PGA = 16)
3. Formula for voltage calculation
The digital value supplied by the ADS1115 depends on the measured voltage and the FSR. The formula is as follows:
-
- : The ADC works with 16 bits, but the measuring range is bipolar (±FSR), so the maximum resolution is .
- Digital value: The value reported by the ADC is between (minimum) and (maximum).
- FSR: The full-scale range, depending on the PGA setting.
Example:
- Assumed PGA setting: ±2.048 V (standard, FSR = 4.096 V)
- If the digital value is :
-
4. Interaction with the TMP35 sensor:
Set FSR:
- Use ±2.048 V (standard), as the TMP35 operates between 0.5 V and 1.75 V.
Measure voltage:
- Read the digital value from the ADS1115 and calculate the voltage:
Convert voltage to temperature:
- Use the TMP35 formula:
Memory measurement for 1 month
1. Data format of the stored temperature measurements
An MQTT message typically contains:
- A topic: e.g.
“Temp”(approx. 4-10 bytes, depending on the name). - A payload: e.g. the temperature as a string, e.g.
“23.45”(approx. 5-10 bytes, depending on the accuracy). - Additional overhead, such as timestamps and metadata, when InfluxDB stores the data (approx. 20-50 bytes per entry).
approximate assumption: 50 bytes per measurement.
2. Number of measurements
I send a measurement every 5 seconds. That’s 30 days within one month:
- Measurements per day:
- Measurements per month:
3. Storage requirements
You save 50 bytes per measurement (assumption). The total size results from:
with values:
Note: This is a rough estimate and does not include other measurement data such as humidity.